5500 Westown Parkway, Suite 190
West Des Moines, Iowa 50266
5500 Westown Parkway, Suite 190
West Des Moines, Iowa 50266
Iowa has three classes of public roads: the state primary highways, secondary (county) roads and city streets. The state highways serve the need for travel and transport between Iowa's major cities and shipping/receiving points. City streets provide to homes, shopping, employment, civic resources, and services. County roads provide rural land access for farming, living, livestock production, and recreation. On the people side, they enable convenient rural residency, access to schools, and connect workers to jobs. On the economic production side, they facilitate the distribution of seed and fertilizer from suppliers to myriad field locations in the spring and fall collecting the grains harvested from all those fields in the fall.
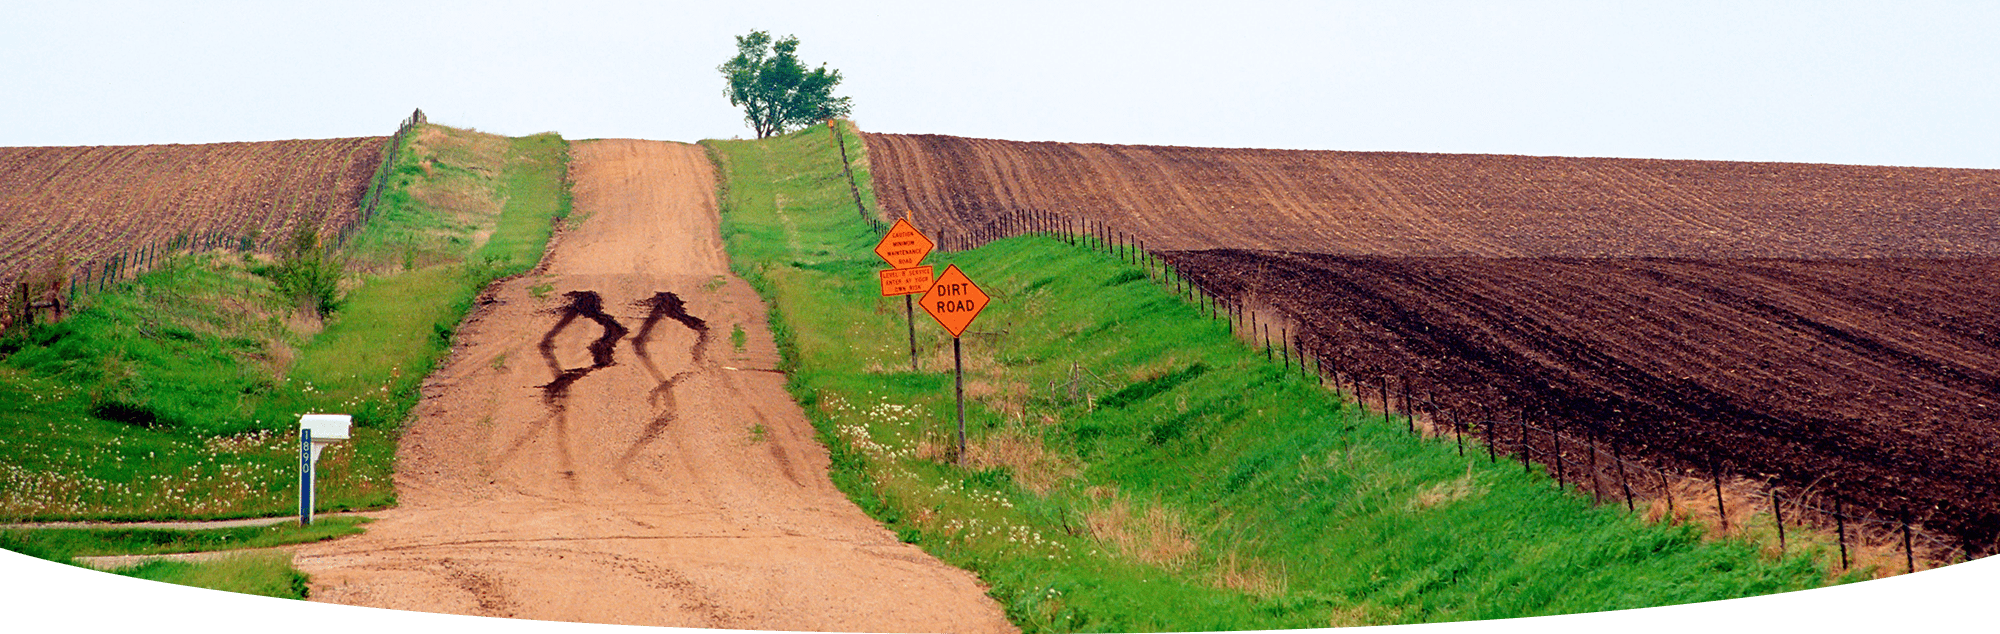
Iowa county roads are divided into two systems. The first, called Area Service roads primarily serve connect vehicles to rural area endpoints where trips start or end. These roadways are mostly gravel and earth surfaced. For them, providing access is more important than handling traffic levels. The second, known as the Farm to Market network, collect the Area Service originated trips and provide all-weather routes to destination points. These links are mostly paved and serve both access and traffic carriage needs.
County roads provide drivable surfaces to carry vehicles from where they started to their destinations. Culverts carry runoff and snow-melt underneath, so it doesn't interfere with travel conditions. The type of surfacing varies according to the need: infrequent land access can be handled via earth surfacing, roads with 10 to 200 cars/trucks per day are granular surfaced, seal coat toppings facilitate still more traffic and begin to offer all weather reliability, and pavements are used to support higher traffic, heavy truck movements and year-round service.
Roads enable the movement of vehicles but brides enable free circulation of traffic. Healthy bridges maximize this freedom of movement. But if there gets to be too many deteriorated or weight limit posted structures, land can no longer be efficiently accessed.
All road agencies work hard to enable travel that is convenient, efficient and safe. The safety component of this service is present in all levels of design, construction and maintenance. It is present in the form of curves being matched to expected driving speeds, provision of sight distance, shoulders, embankment slope recoverability, warning and regulator signage, pavement markings, rumble strips at intersections, winter snow and ice removal, work zone delineation, guardrails and bridge load carrying capacities. In recent years, there has been national emphasis on reducing fatalities. Iowa's counties have participated in this effort by upgrading signs, adding rumble strips to alert motorists when they begin to depart from the traveled way, and through the making of systemic improvements that reduce overall accident rates.
County roads serve rural Iowa transport needs in two capacities: Local Access roads assure a public road connection for every parcel of land; Farm to market roads also provide access and, in addition, serve as conduits that collect the flow of people and commodities, channeling them to and from towns and terminals. Even though county roads are considered "low volume" the daily travel they carry is equivalent to a single vehicle making 60 round trips to the moon.
| Category | Farm to Market | Local Access | Total |
|---|---|---|---|
| Dirt | 0 | 4,425 | 4,425 mi. |
| Gravel | 13,282 | 52,955 | 66,237 mi. |
| Paved | 16,869 | 1,890 | 18,759 mi. |
| Total | 30,151 | 59,269 | 89,420 mi. |
| Miles of travel per day (by all vehicles) | 12,237,982 | 2,862,596 | 15,100,578 travel mi./day. |
| Average daily traffic count | 406 | 48 | 169 vpd. |
| No. Bridges | 7,049 | 11,355 | 18,404 count. |
| Length of Bridges | 724,454 | 730,904 | 1,455,358 ft. |
Individual counties vary greatly in total miles, number of bridges and traffic levels. Each one customizes its road network to fit with the way the private sector needs to operate.
| County | Total Miles | Total Bridges | Average Daily Traffic |
|---|---|---|---|
| Adair | 1,013.00 | 276 | 86 |
| Adams | 717.00 | 172 | 71 |
| Allamakee | 858.00 | 167 | 147 |
| Appanoose | 744.00 | 170 | 130 |
| Audubon | 745.00 | 197 | 77 |
| Benton | 1,237.00 | 322 | 191 |
| Black Hawk | 765.00 | 230 | 375 |
| Boone | 968.00 | 104 | 183 |
| Bremer | 713.00 | 192 | 197 |
| Buchanan | 956.00 | 256 | 219 |
| Buena Vista | 1,002.00 | 135 | 161 |
| Butler | 951.00 | 239 | 131 |
| Calhoun | 993.00 | 178 | 109 |
| Carroll | 994.00 | 205 | 162 |
| Cass | 893.00 | 220 | 69 |
| Cedar | 946.00 | 258 | 187 |
| Cerro Gordo | 960.00 | 147 | 229 |
| Cherokee | 996.00 | 207 | 126 |
| Chickasaw | 842.00 | 260 | 140 |
| Clarke | 656.00 | 141 | 65 |
| Clay | 965.00 | 136 | 174 |
| Clayton | 1,070.00 | 213 | 147 |
| Clinton | 998.00 | 269 | 193 |
| Crawford | 1,202.00 | 250 | 80 |
| Dallas | 849.00 | 103 | 262 |
| Davis | 793.00 | 168 | 103 |
| Decatur | 764.00 | 168 | 77 |
| Delaware | 905.00 | 238 | 198 |
| Des Moines | 636.00 | 103 | 254 |
| Dickinson | 652.00 | 71 | 224 |
| Dubuque | 764.00 | 205 | 373 |
| Emmet | 641.00 | 68 | 105 |
| Fayette | 1,138.00 | 287 | 141 |
| Floyd | 884.00 | 167 | 172 |
| Franklin | 1,000.00 | 186 | 122 |
| Fremont | 779.00 | 125 | 116 |
| Greene | 953.00 | 141 | 88 |
| Grundy | 828.00 | 229 | 188 |
| Guthrie | 944.00 | 244 | 106 |
| Hamilton | 929.00 | 109 | 153 |
| Hancock | 1,006.00 | 132 | 133 |
| Hardin | 994.00 | 198 | 170 |
| Harrison | 1,083.00 | 140 | 97 |
| Henry | 745.00 | 122 | 185 |
| Howard | 752.00 | 201 | 134 |
| Humboldt | 710.00 | 74 | 125 |
| Ida | 724.00 | 153 | 91 |
| Iowa | 925.00 | 190 | 189 |
| Jackson | 833.00 | 199 | 154 |
| Jasper | 1,219.00 | 293 | 197 |
| County | Total Miles | Total Bridges | Average Daily Traffic |
|---|---|---|---|
| Jefferson | 753.00 | 129 | 163 |
| Johnson | 917.00 | 207 | 411 |
| Jones | 841.00 | 176 | 164 |
| Keokuk | 912.00 | 171 | 80 |
| Kossuth | 1,646.00 | 260 | 117 |
| Lee | 733.00 | 1130 | 263 |
| Linn | 1,128.00 | 241 | 506 |
| Louisa | 588.00 | 114 | 163 |
| Lucas | 629.00 | 166 | 86 |
| Lyon | 1,005.00 | 244 | 157 |
| Madison | 900.00 | 210 | 142 |
| Mahaska | 966.00 | 197 | 125 |
| Marion | 849.00 | 175 | 252 |
| Marshall | 929.00 | 245 | 182 |
| Mills | 684.00 | 127 | 192 |
| Mitchell | 781.00 | 151 | 156 |
| Monona | 1,056.00 | 117 | 92 |
| Monroe | 591.00 | 132 | 86 |
| Montgomery | 714.00 | 166 | 78 |
| Muscatine | 607.00 | 101 | 285 |
| Obrien | 1,013.00 | 235 | 137 |
| Osceola | 728.00 | 157 | 128 |
| Page | 910.00 | 161 | 88 |
| Palo Alto | 944.00 | 125 | 112 |
| Plymouth | 1,420.00 | 383 | 163 |
| Pocahontas | 1,005.00 | 185 | 98 |
| Polk | 727.00 | 132 | 814 |
| Pottawattamie | 1,469.00 | 310 | 189 |
| Poweshiek | 978.00 | 226 | 107 |
| Ringgold | 872.00 | 210 | 64 |
| Sac | 1,027.00 | 199 | 128 |
| Scott | 559.00 | 114 | 538 |
| Shelby | 943.00 | 190 | 92 |
| Sioux | 1,349.00 | 390 | 214 |
| Story | 925.00 | 188 | 319 |
| Tama | 1,146.00 | 289 | 121 |
| Taylor | 910.00 | 214 | 65 |
| Union | 698.00 | 166 | 105 |
| Van Buren | 730.00 | 144 | 105 |
| Wapello | 699.00 | 125 | 199 |
| Warren | 861.00 | 179 | 250 |
| Washington | 904.00 | 162 | 179 |
| Wayne | 829.00 | 149 | 73 |
| Webster | 1,173.00 | 170 | 266 |
| Winnebago | 713.00 | 72 | 116 |
| Winneshiek | 1,042.00 | 309 | 191 |
| Woodbury | 1,336.00 | 289 | 180 |
| Worth | 687.00 | 87 | 151 |
| Wright | 962.00 | 159 | 128 |
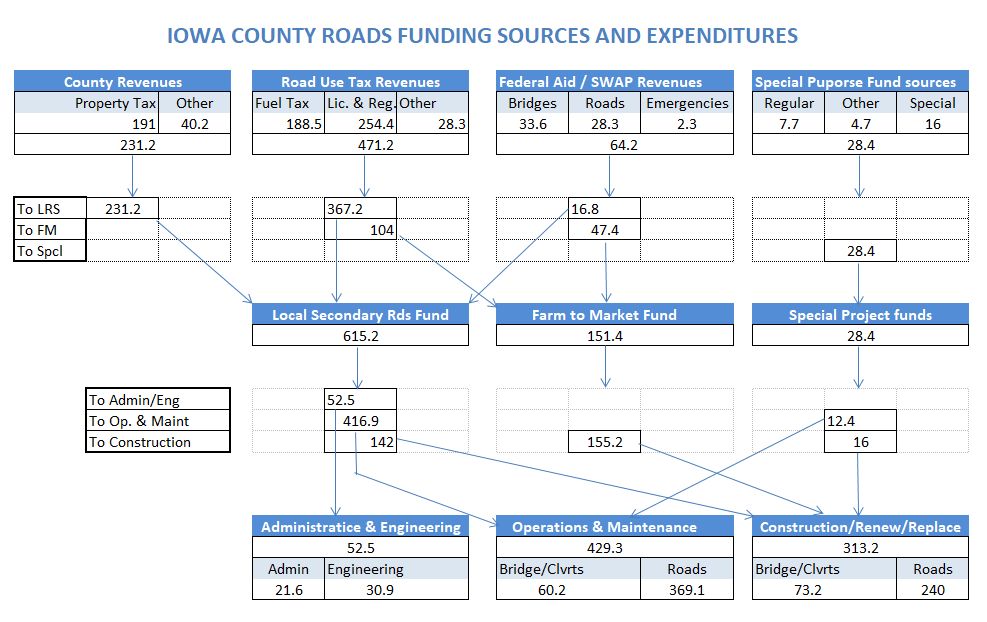
The chart below shows where revenue for Iowa secondary roads comes from, where it is deposited and what it is used for.
The following selection of photos, videos and documents provides an overview of the breadth and depth of Iowa's secondary road system and the multitude of activities required to keep it ready to serve travel and transport needs.

Iowa DOT Bridge condition explorer

Transportation Investment
2016 Structurally deficient bridge report

Future of Iowa county roads - 2017-2037

TR-685 Excel worksheet - Gradation Optimization for Granular Surface Materials